Visualizing Data through Graphs
Agenda
Learning Goal
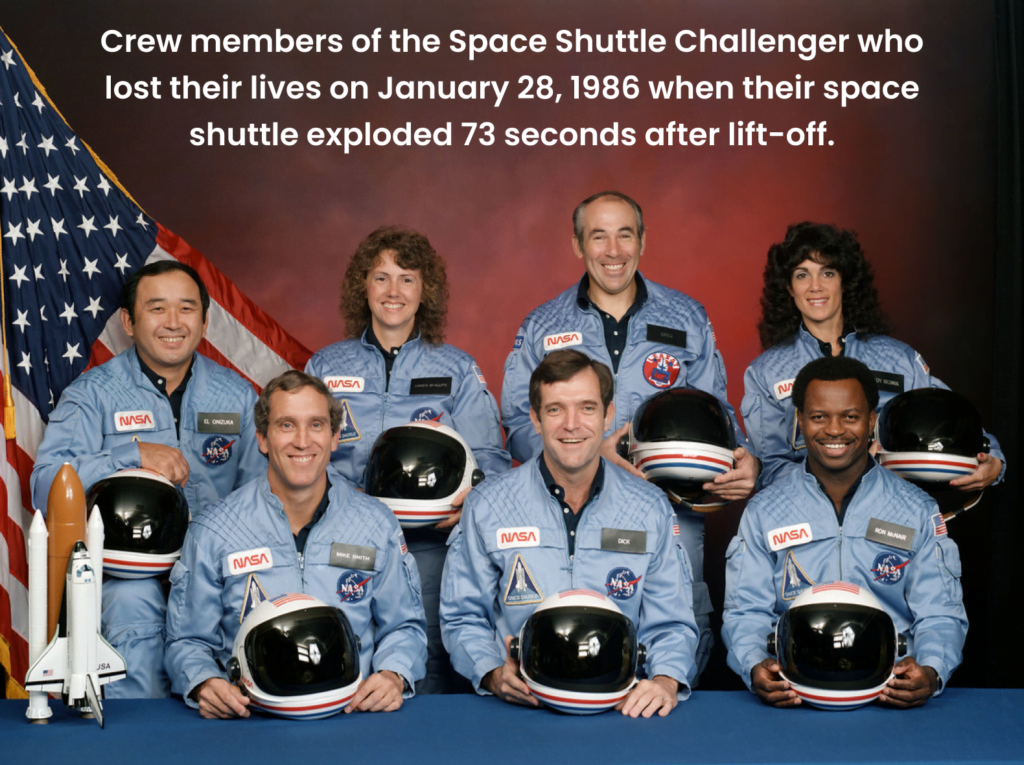
- Learn how a graph could have prevented the Space Shuttle Challenger Disaster.
- Read and complete the questions on the YELLOW slides to learn important details about graphs.
- Complete "Which Graph Would You Choose?" activity on the GREEN slide.
- Practice analyzing a graph on the BLUE slide.
- Summarize important details to remember when making graphs.

During this lesson you will learn how to organize data using a graph.
I know I have it when I can choose the appropriate graph and accurately organize data.
Did You Know...
Scientists use graphs to help them to see patterns and trends in the data they collect during their investigations and experiments.
Lesson Warmup
Think about how much your height has changed since you were born.
How could you show those changes using a graph?
Do you think a graph could save a life?
The crew members of the Space Shuttle Challenger may not have lost their lives on January 28, 1986 if NASA engineers could have convinced Mission Control to postpone the launch due to cold temperatures.